
DevOpSmartBoard
One-stop dashboard solution for all reporting needs in Azure DevOps at organization and project level.


Introduction to DevOpSmartBoard
Azure DevOps is a popular DevOps platform in the current market. Azure DevOps provides end to end project management, version control, build & release pipelines, artifact management along with dashboards. But the limitations with built-in dashboards is that we can see the details at the project level, but not at the organization level (consolidated view of multiple projects). Many customer from a long time were looking for a solution to get insights at the DevOps Organization level.
DevOpSmartBoard is the answer for all the dashboard needs.
DevOpSmartBoard -The Ultimate End-To-End and One Stop Dashboard solution for all the reporting needs in Azure DevOps at organization and project level.
You will have access to all the reports in the 15-days trial period after which you can subscribe on a monthly or yearly basis.Refer our Pricing section for more information.
DevOps SmartBoard currently has the following reports
-
DevOps Organization and project level metrics
-
Query work items with various combination of filters and export to excel
-
User Audit: count of User licenses and types, and display non-active users (not used Azure DevOps from last 30 days)
-
Traceability from Epic to granular level Tasks
-
User Capacity across Teams & Projects
-
Project Health
-
Reports on Azure Pipelines at organization levels.
Uses/Benefits of DevOpSmartBoard
- DevOpSmartBoard is beneficial to quickly provide a brief information about your Devops Organization like no of projects, users etc.
- It is easy to find all the information required for various purpose and by different roles in one place i.e. DevOpSmartBoard
- Provides metrics at the organizational level, which is not possible currently in Azure DevOps
- Traceability report from top level work item to the granular level item along with links to commits and bug, test case work items is highly beneficial for tracing end-to-end
- Capacity planning is good in Azure DevOps but restricted to a single team view, DevOpSmartBoard helps in visualizing the capacity details across teams in a project
- Azure Pipelines reports across project and definitions provides great help for teams to understand the metrics of build and release executions and take corrective actions
- Project Health reports benefits Managers to quickly understand any bottlenecks in the project execution, understand the behavior based on trend charts and take corrective actions
Details about the various reports of DevOpSmartBoard:
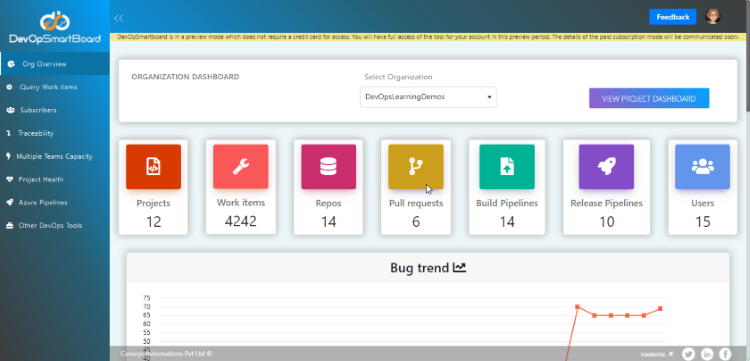
- Organization Dashboard: This view provides metrics about the Azure DevOps Organization. In the first section of the report, the Tiles will display the:
-
Count of Team Projects in the DevOps Organization
-
Total count of work items, Azure Repos, count of Pull-Requests, Build & Release Pipeline count
-
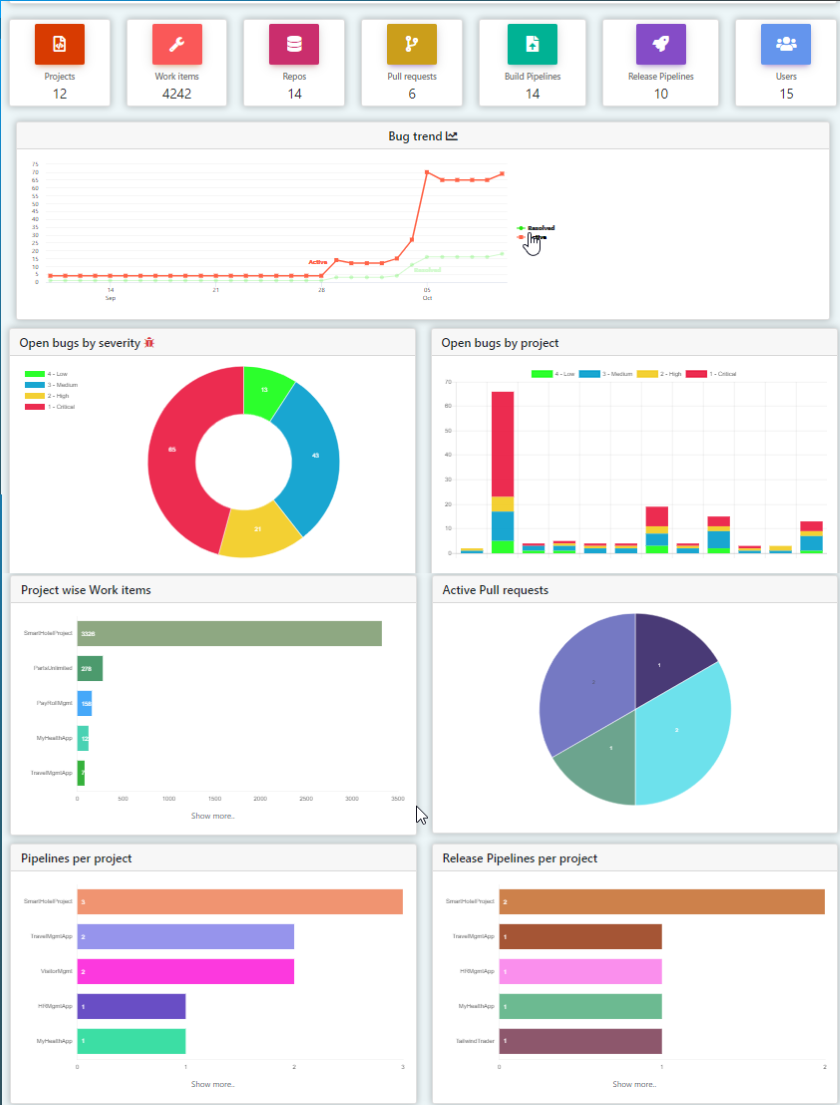
Total number of users in the organization. Following charts will be displayed:
-
Bug trend
-
Open bugs by severity and Open bugs by project.
-
Count of work items and Active Pull requests by projects
-
Count of Build pipelines and Release pipelines per project
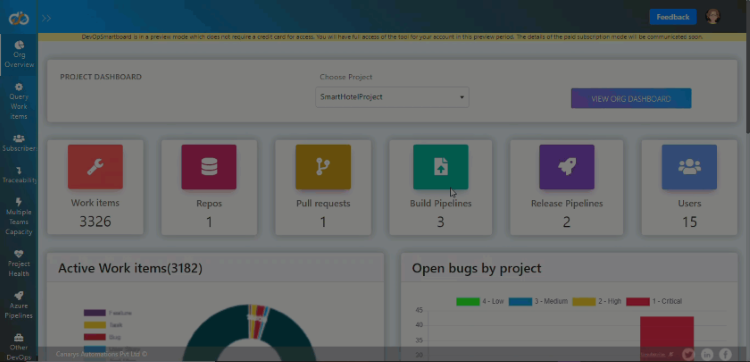
- Project Dashboard: Important metrics of the Team Project like count of work items, repos, pipelines trend etc. the Tiles will display:
-
Total count of work items, Azure Repos
-
Count of Pull-Requests
-
Build & Release Pipeline count
-
Total number of users in the project
Following charts will be displayed -
-
Active Work items by type
-
Open bugs by severity
-
The trend charts for Build and Release executions
-
Total count of outcome of the execution of build & release
-
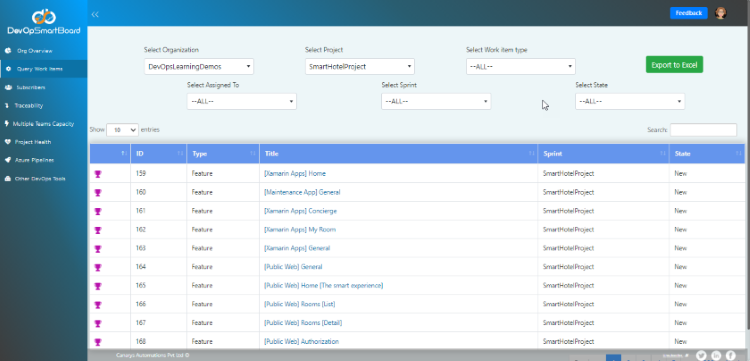
Query Work Item: This report provides work item query option across projects with many choices to filter the data.
-
Subscribers: This report basically provides the user details of the DevOps organization, list of users and access to the projects in the organization and based on the activity for last 30 days. It helps them to study the active/inactive status of user and save on license cost by revoking the license for non-active members.
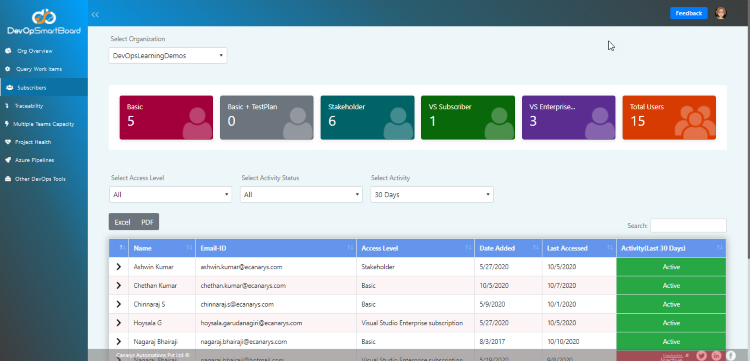
-
Traceability: Provides traceability from Epic to Features and from PBI to Task, Test Cases and Bugs. This report helps project managers and leads, to look for end to end traceability right from top level work item type to the lowest level of work item, along with other related items, commits etc.
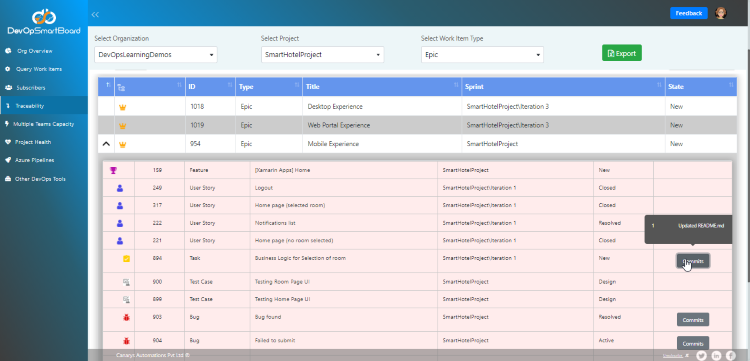
-
Multiple Team Capacity: Calculates the capacity of members across teams, following same sprint cycle in a project including off-days. Also, this extended to calculate capacity across multiple projects.
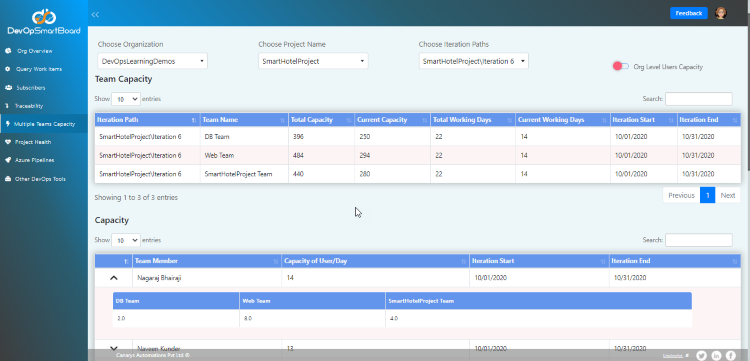
-
Project Health: Provides key indicators about the project progress, health like critical bugs trend, build & release failure trends etc.
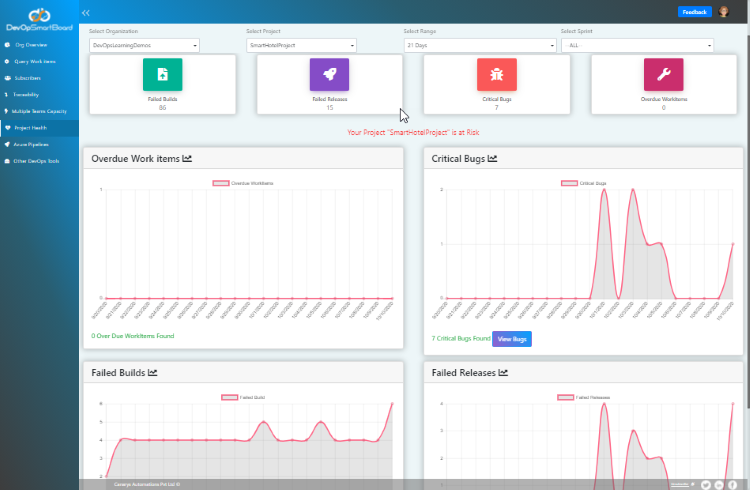
-
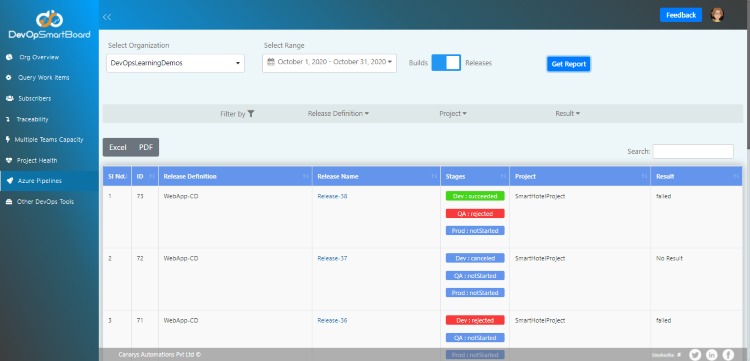
Azure Pipeline Report: Insights into the deployment of apps at different environments. This report provides the details of build and release pipeline results across projects that is at the Azure DevOps Organization level, over a certain duration. You can filter based on projects, definitions, stages, results etc.
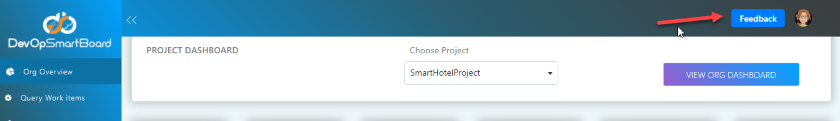
Feedback: To provide feedback or to report issue click on Feedback button and fill in the details and submit.
And lastly to sign-out from the DevOpSmartBoard, hit the log-out button.
We will cover the details of each of the reports in next blogs.
For other reports and charts details of DevOpSmartBoard, you can search related blogs by searching with the tag DevOpSmartBoard.
For more details contact us at vststoolssupport@ecanarys.com